
The emergence of Nifty Total Market Index in India


Have you ever thought of capturing the potential of almost the entire stock market with a single investment?
This is possible with the Nifty Total Market Index (TMI), which includes all or most of the stocks traded in a particular market. It represents the entire market by including a wide range of stocks from different companies.
This may be one of the ways an investor can benefit from a country’s economic growth without having to select which individual companies to invest in.
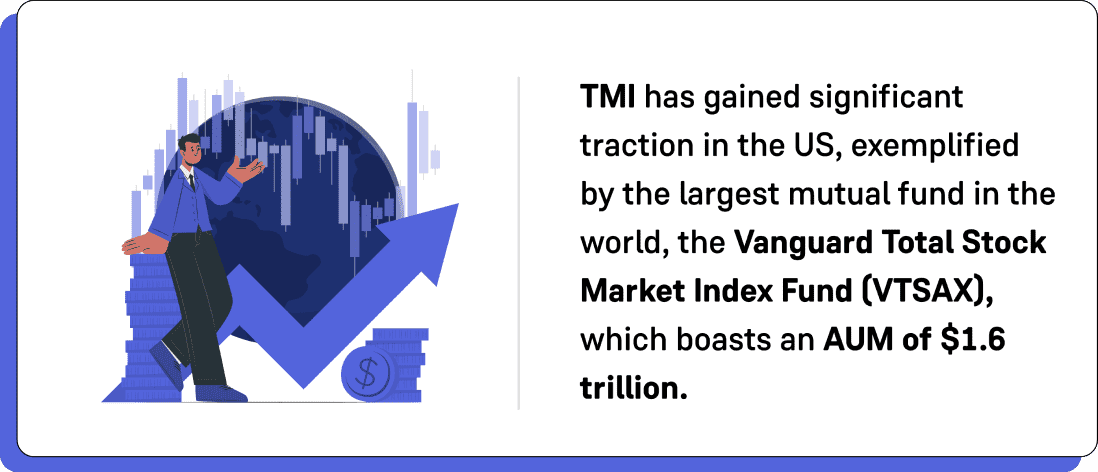
In the US, for example, many people are familiar with index funds that track well-known indices like Standard & Poor's 500 (S&P 500) or the Dow Jones Industrial Average. However, these funds typically have a higher weightage of large cap companies.
In contrast, TMI funds like the VTSAX, for example, seek to track the investment performance of the Center for Research in Security Prices (CRSP) U.S. Total Market Index, which represents ~100% of the investable US stock market1 across large, mid, small, and micro-cap segments.
This way, investors gain exposure to the entire US stock market at a low cost, which helps to better understand its widespread popularity.
Rise of Nifty Total Market Index in India
In FY 2023-24, India’s real GDP grew by 8.2%, from 7% in FY 2022-23. The country is already on track to become the world’s third-largest economy, surpassing Japan and Germany.3
The Nifty Total Market Index aims to track the performance of ~750 stocks from 22 sectors across large, mid, small, and micro-cap segments, enabling investors to access almost 96% of the stock market with one fund, compared to 56% covered by the Nifty 50. This makes it a potentially helpful gauge of the country's economic performance.
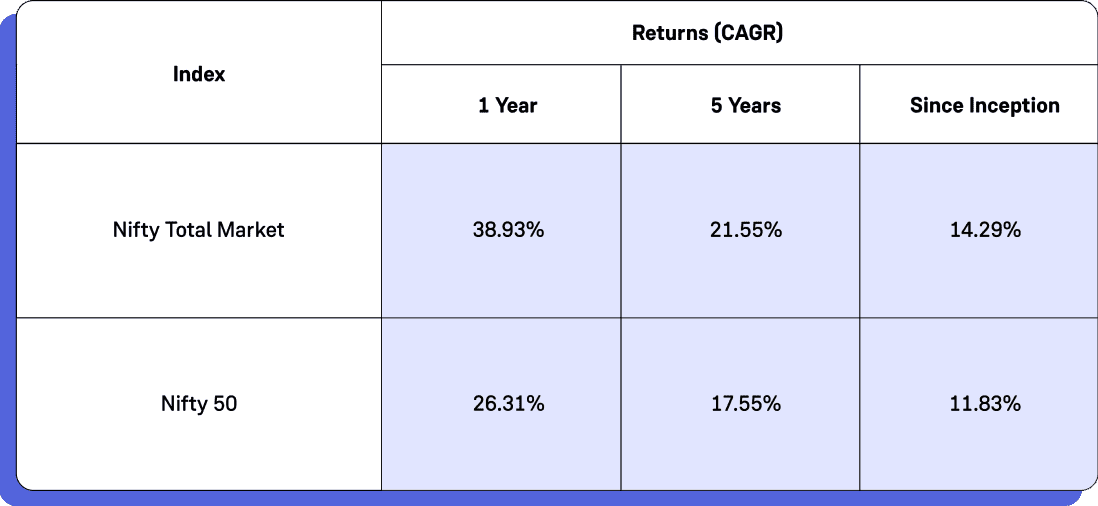
Notably, the index has historically outperformed Nifty 50, which is often viewed as the benchmark for the Indian stock market.
As of July 31, 2024, the top 10 constituents by weightage in the index include:

What does the Nifty TMI offer Indian investors
- Broader Market View: One key feature of the Nifty TMI is that each stock in the index is weighted according to its free-float market capitalisation, i.e., the shares available for public trading. This aims to have the index reflect the total market capitalization of the Indian equities market.
- Diversification: Unlike the Nifty 50, which is heavily weighted towards sectors like IT and Financials, the Nifty TMI offers potential exposure across ~22 sectors.6 This diversification may help mitigate the risk associated with sector-specific downturns.
- Growth Potential: All stocks that are part of the Nifty 500 and Nifty Microcap 250 form part of the Nifty TMI. The inclusion of mid, small, and micro-cap stocks in the Nifty TMI provides exposure to companies with higher growth potential, which can be particularly advantageous during bullish market phases. However, investors should consult their financial investor to know about their risk appetite i.e. risk taking capacity and the volatile stock market.
For investors seeking diversification and capitalising on India's growth potential, the Nifty Total Market index aims to provide a long-term wealth creation opportunity.

