

Groww Nifty Total Market Index Fund Direct Growth
Holdings (751)
| Name | Sector | Instrument | Assets |
|---|---|---|---|
HDFC Bank Limited | BANKS | Equity Shares | 5.5% |
ICICI Bank Limited | BANKS | Equity Shares | 4.9% |
Reliance Industries Limited | PETROLEUM PRODUCTS | Equity Shares | 4.2% |
Bharti Airtel Limited | TELECOM - SERVICES | Equity Shares | 2.9% |
Larsen & Toubro Limited | Construction | Equity Shares | 2.2% |
State Bank of India | BANKS | Equity Shares | 2.0% |
Infosys Limited | SOFTWARE | Equity Shares | 1.9% |
Axis Bank Limited | BANKS | Equity Shares | 1.7% |
Bajaj Finance Limited | FINANCE | Equity Shares | 1.5% |
Mahindra & Mahindra Limited | AUTO | Equity Shares | 1.4% |
Holding analysis
Equity / Debt / Cash Split
- Equity99.8%
- Debt0.0%
- Cash0.2%
Equity sector allocation
- Banks18.9%
- Finance11.3%
- Software6.5%
- Consumer Non Durables6.3%
- Pharmaceuticals5.6%
- Auto5.3%
- Petroleum Products5.0%
- Construction3.9%
- Telecom - Services3.6%
- Others33.6%
Advanced ratios
Scheme Performance
Annualised returns
as on 30 Sep 2026| 5Y | 3Y | 1Y | Since Inception | |
|---|---|---|---|---|
| Groww Nifty Total Market Index Fund Direct Growth | 0.00% | 0.00% | -1.85% | 10.35% |
| Scheme Benchmark - Nifty 50 TRI | NA | NA | -7.09% | 7.13% |
| Additional Benchmark - Nifty Total Market TRI | NA | NA | -1.32% | 11.24% |
Current value of standard investment of ₹10,000
as on 30 Sep 2026| 5Y | 3Y | 1Y | Since Inception | |
|---|---|---|---|---|
| Groww Nifty Total Market Index Fund Direct Growth | ₹10,000.00 | ₹10,000.00 | ₹9,815.17 | ₹13,350.00 |
| Scheme Benchmark - Nifty 50 TRI | NA | NA | ₹9,291.47 | ₹12,240.94 |
| Additional Benchmark - Nifty Total Market TRI | NA | NA | ₹9,868.26 | ₹13,668.36 |
Please Note: Returns greater than 1 year period are compounded annualized returns (CAGR). Load is not taken into consideration. Different plans shall have different expense structure. In case the start/end date is non business day, the NAV of previous working day is used for computation. Past performance may or may not be sustained in future and its not a guarantee of any future returns. The scheme is managed by Aakash Chauhan, Nikhil Satam and Shashi Kumar (FMs). Please refer "Fund Management" section below for details of other schemes currently managed by the Fund Manager(s).
Expense ratio, exit load and tax
Expense ratio: 0.20%
Inclusive of GST
Exit load
*0.25% is payable if units are redeemed/switched-out within 7 days from the date of allotment. Nil - After 7 days
Stamp duty on investment: 0.005%
from July 1st 2020
Fund management
Riskometer
This product is suitable for investors who are seeking*
- Returns commensurate with the performance of Nifty Total Market Index - TRI, subject to tracking error.
- Long term capital appreciation
- Investors looking to invest in India's growth potential and across sectors & market caps in order to benefit from a well diversified portfolio with long term capital appreciation.
- Very High Risk
Scheme Riskometer
Groww Nifty Total Market Index Fund Direct Growth

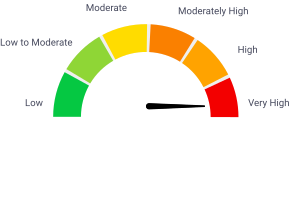
- Low
- Low to Moderate
- Moderate
- Moderately High
- High
- Very High
Benchmark Riskometer
Nifty 50 TRI
- Low
- Low to Moderate
- Moderate
- Moderately High
- High
- Very High